It was a pleasure to have Professor Dragan Gasevic from the School of Informatics at the University of Edinburgh present a seminar at Monash University on the critical challenges that require immediate attention for learning analytics. I was extremely excited to attend this session considering Prof. Gasevic vast experience and contribution to the development of learning analytics research.
Date: Thursday 15 June 2017
Time: 1pm – 2pm
Location:Rotunda 2, 46 Exhibition Walk, Clayton Campus.
What is Changing?
Education sector has recently been facing major challenges around the world with funding cuts: yet they are expected to continue educating more people and deliver high quality education. There is also continuous push to enrich the experience of our learners and provide them with more active learning experiences. Some educators are adopting padegogical models such such as flipping the classroom and means to monitor and make learning more effective.
In many cases, in order to address this problem, people are turning to technology. But in the process, they are reducing/eliminating social queues an instructor may otherwise get in a face-to-face session (such as their energy level, nodding, facial impressions etc which are valuable in improving the class experience).
Learning Analytics (LA)
LA is an attempt to recover or re-establish the feedback loops between students and instructors which are either missing or weak. Students interact with Leaning Management System (course material) and use external networking tools (twitter/facebook/blogging/eportfolios) and multimedia resources. There is also lot of data in the student information systems (student records). Interactions with these tools leave behind digital footprints (logs etc) and overtime these can be leveraged with statistical methods, data-mining, machine learning and social network analytics to identify patterns (and interpret them) to provide feedback to learners and teachers.
Some early case studies:
- Course Signals at Purdue University
- developed a tool using simple statistical methods (logistic regression) to predict at-risk students (high risk, moderate risk, no risk traffic lights) to allow early interventions to minimise drop-out. This dashboard was presented to both staff and students. Results showed 10-15% higher retention rates for those students who took at least on unit using course signal. (Ofcourse, one can challenge on the causality of the model (interpretation of the statistics) as there are other factors in play but one cannot deny the benefits).
- Further was conducted on the frequency and the nature of feedback messages sent out by the Course Signals system and whether it was effective. What was found was that the feedback to the students increased rapidly with the Course Signals the systems however the nature of the feedback was summative in nature (without providing much/any guidance in terms of instruction and improvement of learning). So can we do something better?
- E2 Coach System at University of Michigan
- E2 Coach System took a different approach to maximise the opportunity for students improve success in learning ( 1. identify effective good practices from student and generate knowledge-base of motivational advice for incoming cohort and 2. ask students to set their own goals/expectation (measure of better than expected – which of-course varied for different students). The system sent messages/feedback which was motivational (based on self-determination theory and against their own measure of better than expected) aimed to promote autonomy and also laid out activities and effective study practices. Found that on average improved students grade by 5% (half a letter grade).
Challenges in LA
- Validity – is whether the model developed on a huge dataset still work or replicate its glory in other environments.(as highlighted in the Open Academic Analytics Initiative). There are inconsistent results eg. in social networks environment where the effects of network centrality may not always correlate with academic performance (paper). Granovetter theory (paper) states that if a network is based on weak ties, then the benefit can be leveraged from the social network (reading)(reading2).
- Feedback – how should feedback provisioned to stakeholders?
- Dashboards – Are they effective and well designed? Are they correctly interpreted? Stanford study (unpublished) showed negative impact of dashboard which average grades of all their courses(1. Anchoring effect -rely too heavily, or “anchor,” on one trait or piece of information 2.students have tendency to be highly over confident and 3. top students benchmark against achieving (green – just above class average even if its below their personal goal). (Similar UniMelb study)
- Teaching staff don’t quite understand (all) dashboards, visualisations and basic statistics.
- Adoption
- There are very few institution-wide examples of LA adoption. This may dues to
- lack of skills for data-informed decision making (in students and teaching staff)
- how the significant problems are identified by institutional leaders and how the LA initiatives are implemented & monitored with stakeholder population
- proper and equal engagement with different stakeholders (paper) (model)
- There are very few institution-wide examples of LA adoption. This may dues to
Directions
Firstly, Learning Analytics computational methods need to be deeply integrated with what we know about research and practice of learning and teaching and education. LA is not just data science. The most important component is the “Theory” or some “theory”coming from your practice, that is, maybe you want to test certain (relevant) questions. The second component is Design. This is made up of three things: (1) the interactive dashboards need to be properly designed (intuitive) and (2) instructional/learning design as it affects the analytics and data collected/pedagogy and (3) Study design (our claims – correlations (important) don’t imply causations) . 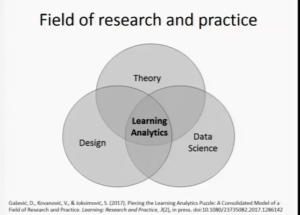
Secondly, instructional conditional or learning design shape how students behave and thus influences the learning analytics results (paper). Also, we need to be creative about the data (instrumentation of what is captured, integration of data sources, modelling – be question driven and not data driven)
Thirdly, there is a need for better instrumentation of learning environments (paper). Software engineers alone should and/or can not instrument the learning environment (click and view counts are not sufficient). There is a need for others to engage deeply on how to measure learning and set hypothesis.
Fourthly, the feedback need to speak task specific language and should contain instructional guidance. for learners (where to go). In that regards, are emails (instructions) better than visualisation (numbers) (presentation)? (submitted: Pardo et.al : ‘Using learning analytics to the provision of personalised’ feedback showed positive gains) Interpretations might work better than visualisations in some cases.
What would I conclude from the presentation?
In most cases, we are motivated by the over-whelming supply of data but haven’t figured out what critical questions to ask or problem need to be solved?. Additionally, Learning analytics is not only about deficit models to identify problems but rather has to be proactively used to improve teaching and learning.
Also, one size fits all does not work in learning analytics (institutional differences – population, mission, funding models, targets, culture, historical decisions, internal constraints, legislations). Additionally, instructional conditions shape learning analytics results.
Finally, Theory is extremely important. With a huge dataset, everything may look statistically significant. This is where theory can tell you which of these statistically significant associations are meaningful. This process also gets complemented by ensuring the need of having multi-disciplinary teams in LA.
Video Source: https://www.youtube.com/watch?v=mx79UZ1dbdU


